
Improving Purchase Confidence on the Product Display Page
Turning the tables on the PDP
Company
Mountain Warehouse
Platform
Mobile and Desktop Website
My role
UX Research
Timeline
2 months


Why This Matters
Users navigating transport systems, like customers choosing products, must make decisions with incomplete information.
This project demonstrates my ability to:
• Reduce decision friction in high stakes journeys
• Design for clarity, accessibility, and confidence
• Align multiple stakeholders around user needs
• Turn research into measurable service improvements
Problem
Users lacked confidence when making purchase decisions on the redesigned PDP. The experience did not effectively support users in, finding key information, interpreting product details and trusting their purchase decisions. This resulted in increased friction and potential loss in conversion.
My Role
• Led end to end research strategy across multiple phases
• Conducted qualitative and quantitative research
• Defined success metrics across user and business needs
• Influenced product direction through insight synthesis
• Facilitated stakeholder alignment across teams
• Embedded a test and learn culture through experimentation

Method mapping
Approach
Phase 1: Discovery & Alignment
• Stakeholder Interviews & Assumption Unpacking (8 Participants)
• Literature review
• Competitive analysis
• Remote card sorting (78 responses)
• Data Analytics
Goal: Align on assumptions, understand business needs, and define how users expect information to be structured.
Phase 2: Behaviour & Usability
• 1-to-1 semi structured user interviews (5 participants)
• Think-out-loud usability testing (7 participants)
Goal: Understand decision-making behaviour and identify friction in the current PDP experience.
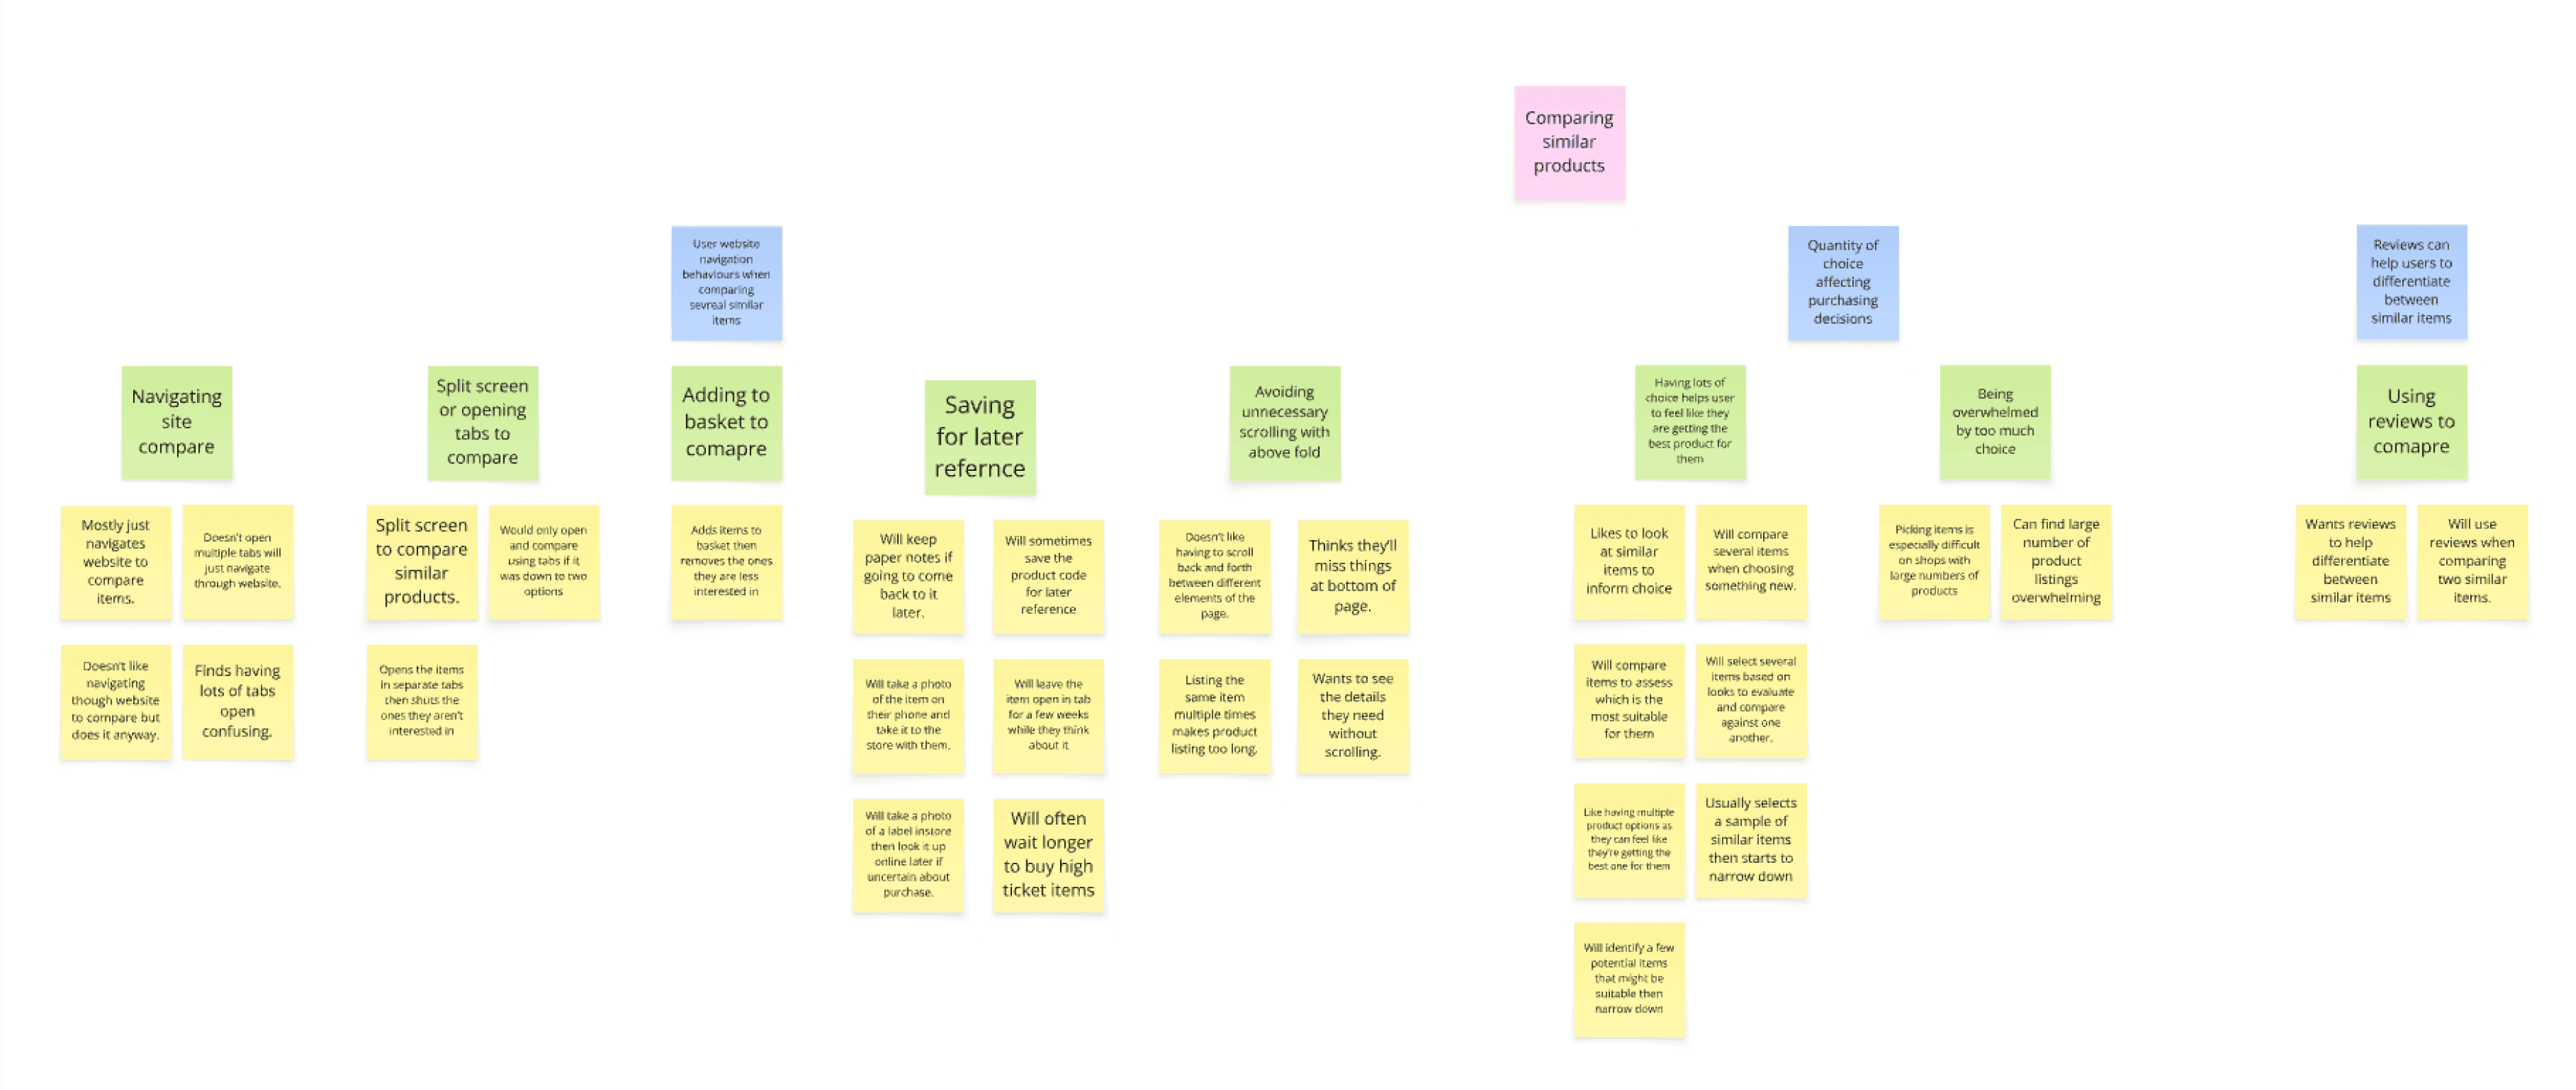
Sample of affinity diagram
Three Key Insights
Across these phases, the research generated 20 distinct insights. From these, three key themes emerged that had the greatest impact on user decision-making and overall PDP performance. These insights highlight the primary barriers to purchase and informed the direction of design improvements.
Size & Fit Confidence is the Primary Barrier to Purchase
What we saw


Insight
Users lacked confidence in selecting the correct size. Especially new customers and in categories like women’s, kids, and footwear.
Impact
Hesitation to purchase or incorrect purchases and increased returns
Opportunity
Provide clearer, contextually relevant size guidance at the point of decision
Model Imagery is Critical for Assessing Fit and Driving Purchase Confidence
What we saw


Insight
Users depend on model imagery to assess fit, making it a critical factor in purchase confidence. Representation matters users are more confident when they can see products on models similar to themselves.
Impact
Lack of relatable imagery reduces confidence and conversion
Opportunity
Prioritise diverse, fit focused imagery to help users visualise products
Lack Comparison Tools Forces Users into Workarounds
What we saw
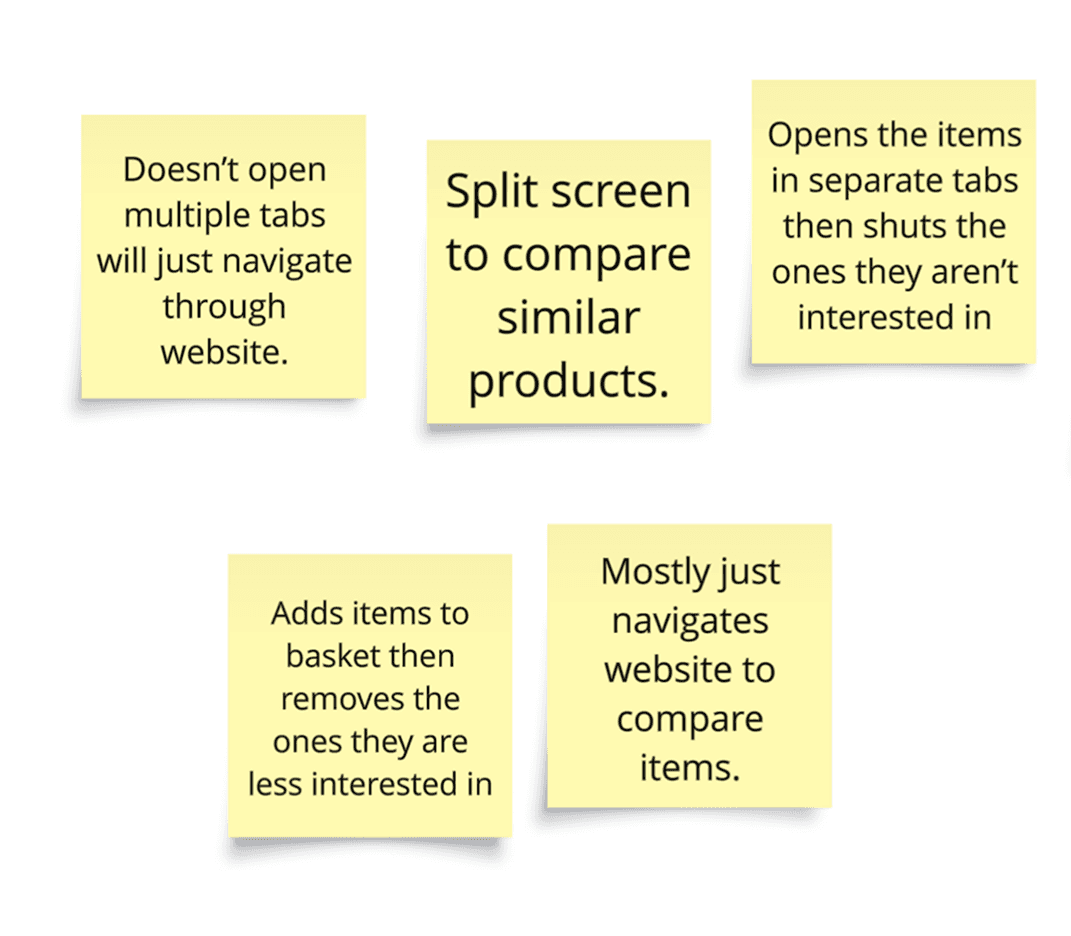

Insight
The PDP does not adequately support product comparison, leading users to create their own workarounds. This indicates a clear unmet need for a more efficient and structured way to compare products.
Impact
Higher cognitive load, slower decisions, drop-offs
Opportunity
Introduce better comparison tools or streamline cross-product evaluation


Previous size guide design
Deep Dive: Improving Size & Fit Confidence
To address the lack of confidence in size selection, I tested iterative improvements to the size guide and selection experience using remote Figma prototype usability testing (46 participants).
Benchmark (current experience)
Task completion: 63%
Error rate: 3.4 per user
SEQ: 4.6/7
Iteration 1 - Improving clarity and relevance
What changed
• Repositioned size guide CTA before the point of decision
• Introduced gender and category-specific size guidance
• Simplified table structure to improve readability (reducing need to scan across large matrices)
Outcome
Task completion: 84% (+21%)
Error rate: 2.3 per user (-1.1)
SEQ: 5.5/7 (+0.9)
Iteration 2 - Reducing complexity and cognitive load
What changed
• Redesigned size guidance into a single, simplified one fold view
• Introduced cm/inch toggle to support generational and geographical user preferences
Outcome
Task completion: 88% (+25%)
Error rate: 0.6 per user (-2.8)
SEQ: 6.1/7 (+1.5)
Through iterative testing, the size selection experience evolved from a complex, table-heavy interaction into a clearer, more accessible decision-making tool. Directly improving user confidence and reducing friction at a critical point in the purchase journey.

Improved size guide design
Impact
Business Impact (A/B Testing 88,000 user sample)
• +4.3% Add-to-Basket rate
• +4.6% Revenue per Visitor
• +9.22% engagement with size guidance
User Impact
• Increased confidence in size selection
• Reduced errors and backtracking
• Faster, more confident decisions
Organisational Impact
• Shift from assumption led to insight driven decisions
• Alignment across product, design, and stakeholders
• Established a test and learn experimentation culture
Outcomes
This research generated 20 validated insights that informed a structured experimentation pipeline.
This led to:
• 24 positive and 8 inconclusive A/B tests
• Consistent improvements in conversion and engagement
• A clearer understanding of key purchase drivers


What I Learned
This project shifted my focus from usability to confidence. Users often had the information they needed, but lacked the confidence to act on it.
I learned that small, well-timed improvements at key decision points can have a significant impact on both user experience and performance. Rather than aiming for a single “perfect” solution, iterative testing and validation proved far more effective in reducing uncertainty and improving outcomes.
It also reinforced the importance of early stakeholder alignment, ensuring insights are understood and actionable is key to turning research into real impact.
What I’d Do in a Transport Context
I’d apply the same research-led, iterative approach to help make journey planning and decision-making clearer, more accessible, and more reliable for a wide range of users.
In practice, that could mean:
• Improving confidence in journey planning and ticket selection by ensuring users have the right information, at the right time, to make informed decisions without hesitation
• Reducing friction across complex, multi-modal journeys by simplifying how users compare routes, modes, and options
• Supporting users during disruption and uncertainty, where clear, timely, and trustworthy information becomes critical
• Designing for accessibility from the outset, aligning with WCAG standards to ensure services are inclusive for all users
• Using data and research to continuously measure and improve outcomes, focusing on real user behaviour and service performance
More broadly, I’m interested in how UX can help shape behaviour making sustainable choices like public transport, walking, and cycling feel easier, more intuitive, and more appealing through well-designed digital experiences.